What it is
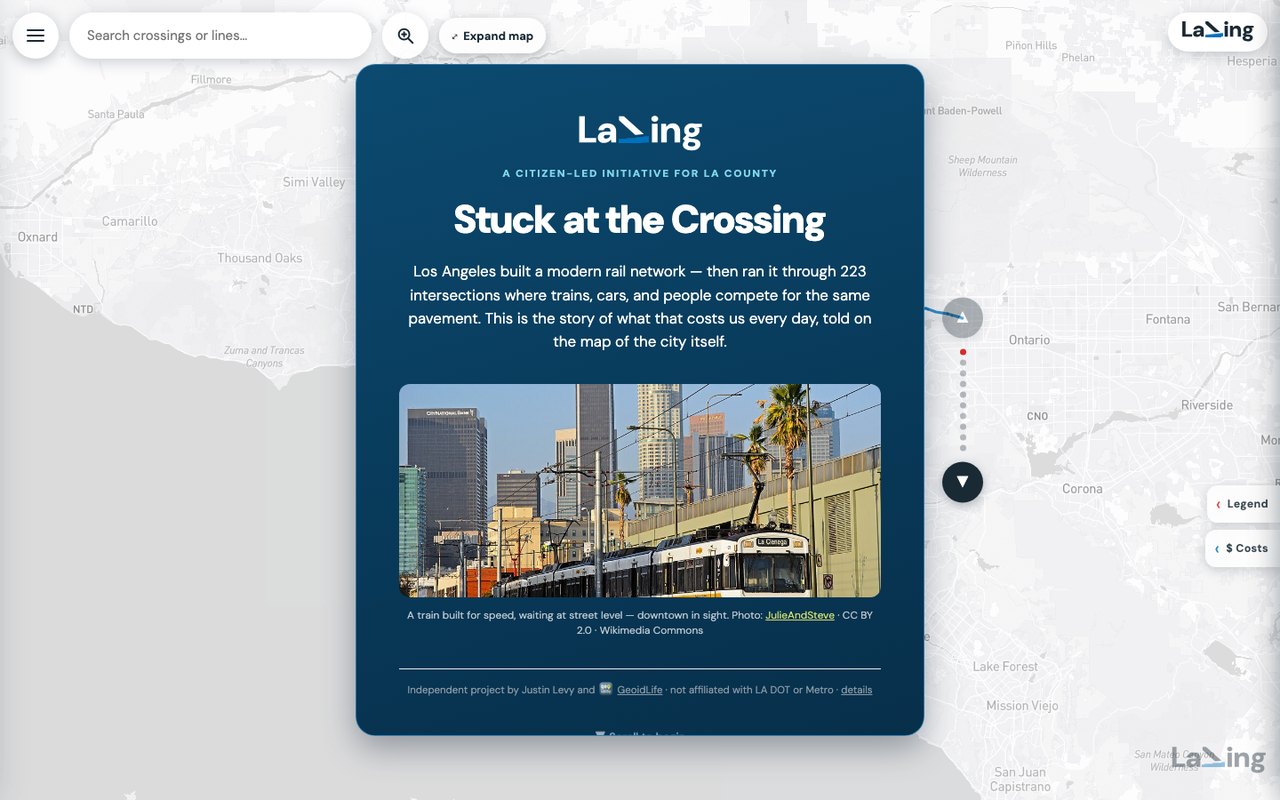
Every day, Metro trains and Los Angeles drivers meet at more than two hundred street-level crossings — behind gates, or waiting at ordinary traffic lights. LaXing tells that story on the map of the city itself: a scroll-driven narrative walks from the county-wide picture down to individual intersections, pairing Metro’s own collision and delay data with a merged, cross-verified crossing inventory (LA Metro KMZ + OpenStreetMap), then hands you the full dataset to explore.
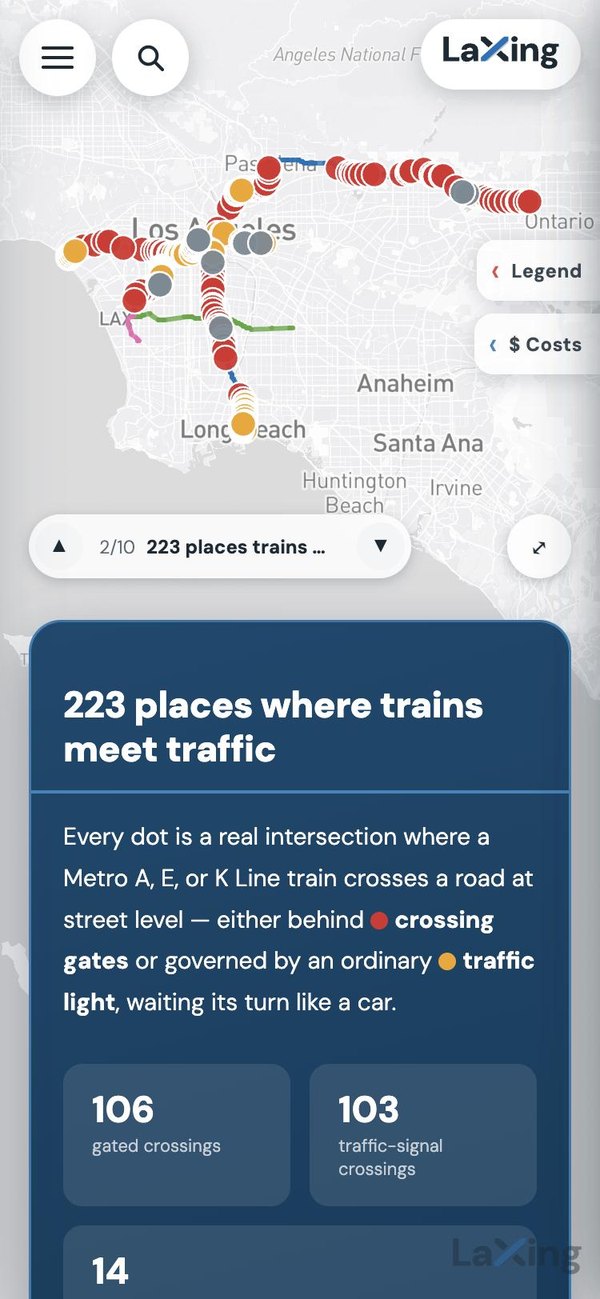
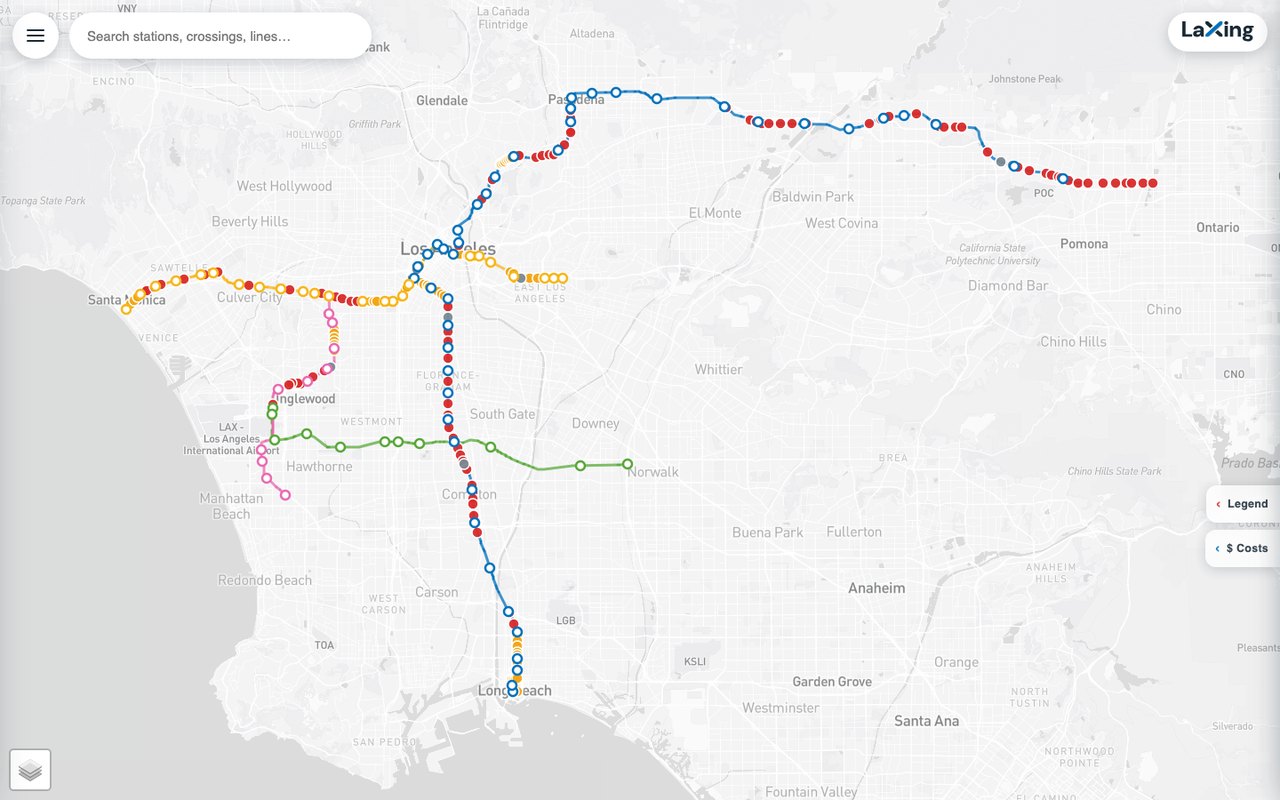
The full interactive map data explorer
Beyond the narrative, the explorer maps all 223 crossings by type, 90 stations with real photographs of crossing-adjacent stops, a train-speed layer computed from Metro’s GTFS schedule, and a trip planner that estimates how much faster each journey would be if its crossings were grade-separated.
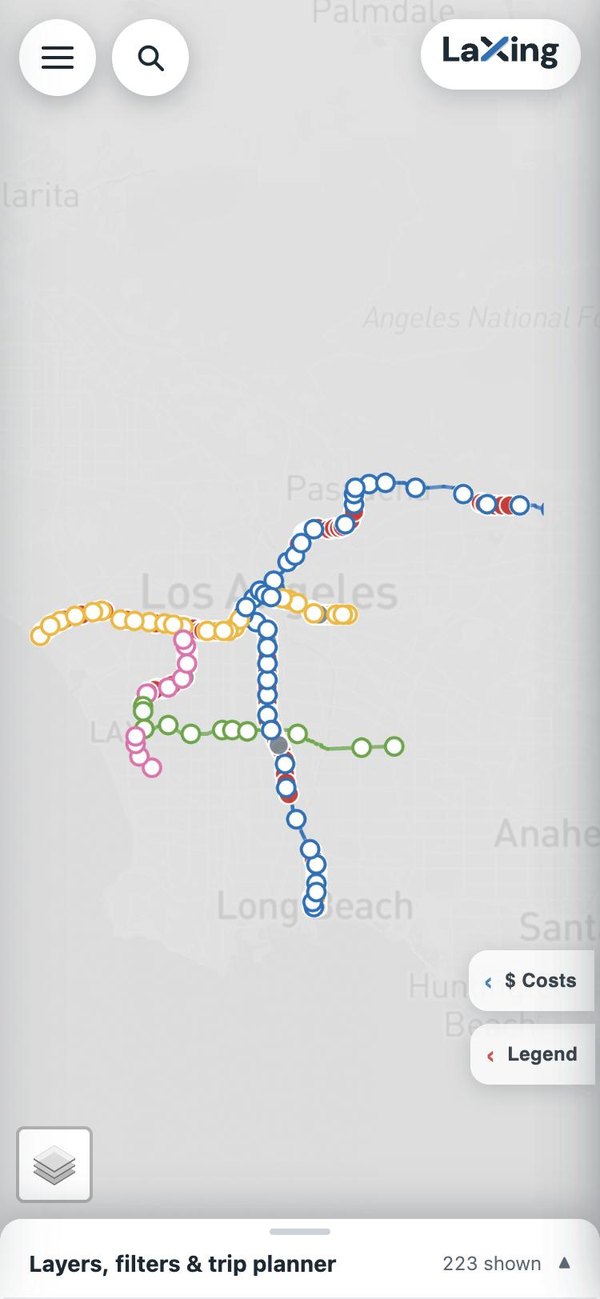
Plan a Metro trip — then see it without the crossings
Pick any two stations on the A, E or K Line and LaXing routes the trip on Metro’s own timetable: the minutes, the miles, and every street crossing you would roll through on the way. Then flip one switch. The comparison tool re-times the very same trip as if every crossing were a bridge or a trench, using the delay Metro measured on the E Line, and hands you back the minutes.
Try the trip planner → Free to use — opens the full map with the planner ready.
Why it matters
What it costs
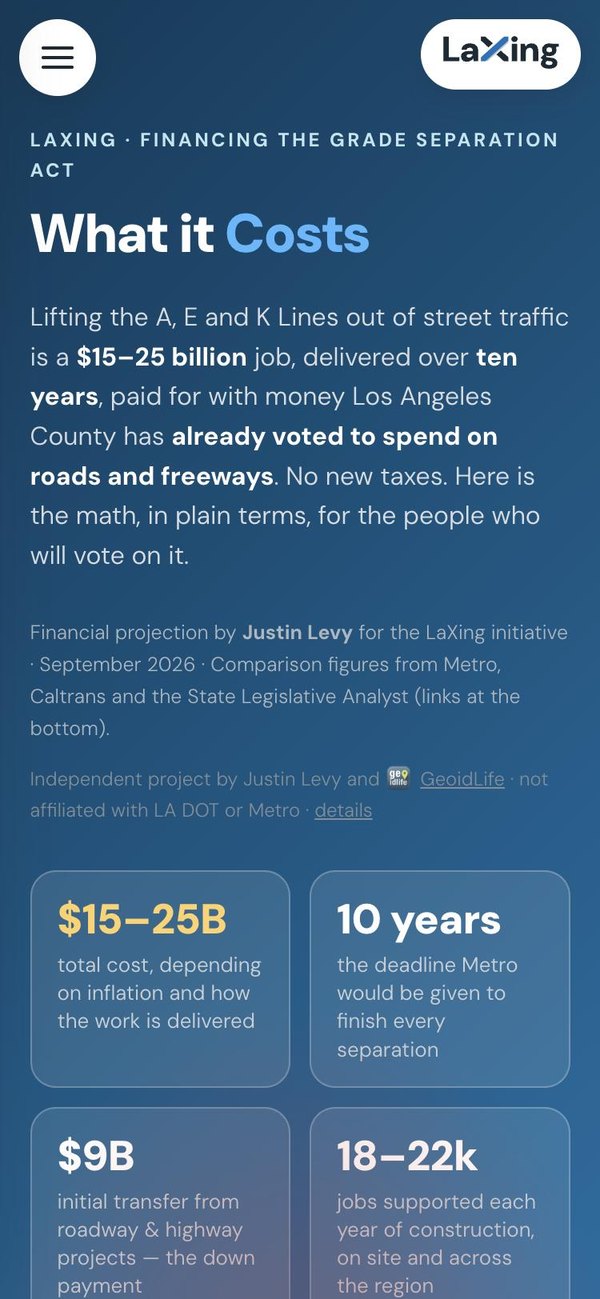
A companion page lays out the financing: roughly $15–25 billion over a 10-year build, paid for by redirecting road and freeway funds voters already approved — starting with a $9 billion transfer from roadway projects — alongside charts of what Los Angeles currently spends on highways versus Metro at the federal, state, county and agency level, and the 18,000–22,000 jobs a year the construction would support.

Data & methods
Sources: LA Metro crossing inventory and 2018 Light Rail Operations Update; LA Metro GTFS schedules; Streets For All signal-preemption analysis (2026); Metro Customer Journey Mapping study (2024); OpenStreetMap contributors (ODbL); station photography via Wikimedia Commons (attributed per image). Basemaps © Mapbox © OpenStreetMap. A citizen-led effort — not sponsored by LA Metro.
Who is behind it
LaXing is not an LA DOT or Metro project and is not endorsed by either. It is an independent, volunteer effort by Justin and his supportive friends: Justin Levy and Nico Tek Solutions / GeoidLife have been building it in our spare time to support a citizen-led ballot initiative for LA County.